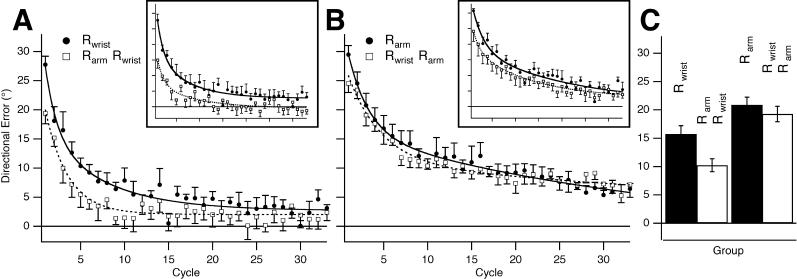
Figure 2. Savings Transfers from Arm to Wrist but Not from Wrist to Arm.
(A) Rwrist on day 1 (group 1, black circles and black curve) and Rwrist on day 2 after Rarm on day 1 (group 5a, white squares and dashed curve). There were substantial savings from Rarm on day 1 to Rwrist on day 2. Inset: Rwrist on day 1 (group 1, black circles and black curve) and Rwrist on day 2 after Rshoulder on day 1 (group 5b, white squares and dashed curve). There were substantial savings from Rshoulder on day 1 to Rwrist on day 2 (mean difference = 7.75° , p = 0.0157). Inset axes scaled as in main figure.
(B) Rarm on day 1 (group 5, black circles and black curve) and Rarm on day 2 after Rwrist on day 1 (group 4, white squares and dashed curve). There were no significant savings from Rwrist on day 1 to Rarm on day 2. Inset: Rshoulder on day 1 (group 1, black circles and black curve) and Rwrist on day 2 after Rshoulder on day 1 (group 5b, white squares and dashed curve). There were no significant savings from Rwrist on day 1 to Rshoulder on day 2 (mean difference = 4.5° , p = 0.1). Inset axes scaled as in main figure.
(C) First pair of bars showing a statistically significant difference in the reduction in mean directional error in the first six cycles for Rwrist on day 2 , after Rarm on day 1, compared to Rwrist on day 1 (groups 1 vs. 5a, mean difference = 5.52°, p = 0.01). Second pair of bars showing no statistically significant difference in the reduction in mean directional error in the first six cycles for Rarm on day 2, after Rwrist on day 1, compared to Rarm on day 1 (groups 5a versus group 4, mean difference = 3.52°, p = 0.12).

