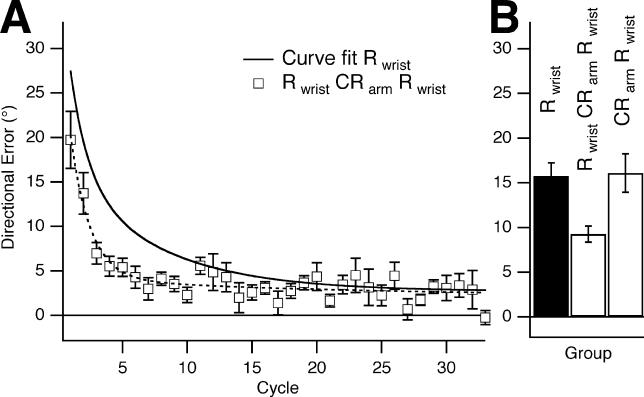
Figure 3. Rotation Learning at the Wrist Is Not Interfered With by Counter-Rotation Learning at the Arm.
(A) Rwrist on day 2, after Rwrist followed by CRarm 5 min later on day 1 (group 7, white squares, dashed curve). There was savings from Rwrist on day 1 to Rwrist on day 2 despite CRarm. The thick black curve represents Rwrist on day 1 (group 1).
(B) Bar graph showing a statistically significant difference in the reduction in mean directional error in the first six cycles for Rwrist on day 1 versus day 2 (groups 1 and 7, mean difference = 6.49°, p =0.0036). This difference was absent when only CRarm was learned on day 1, with no statistically significant difference in the reduction in mean directional error in the first six cycles for day 1 versus day 2 (groups 1 and 8, mean difference = 0.328°, p = 0.88).

