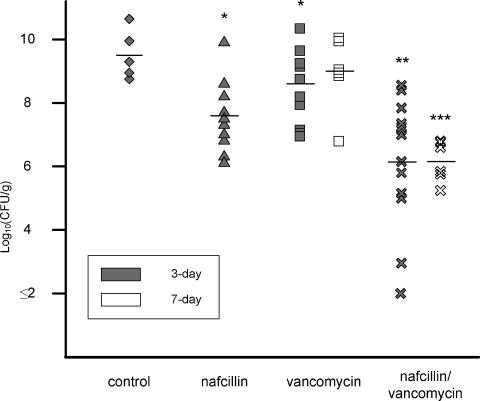
FIG. 3.
Bacterial counts in valve vegetations after 3- or 7-day treatment. Control (⧫), nafcillin at 25 μg/ml (▴), vancomycin at 30 μg/ml (▪), and nafcillin at 25 μg/ml in combination with vancomycin at 30 μg/ml (×) are shown. The horizontal lines represent the mean log10 CFU/gram. Each symbol represents one rabbit. *, P < 0.05 compared to the control group. **, P < 0.05 compared to the control, nafcillin, or vancomycin group. ***, P < 0.05 compared to the vancomycin group (7-day).

