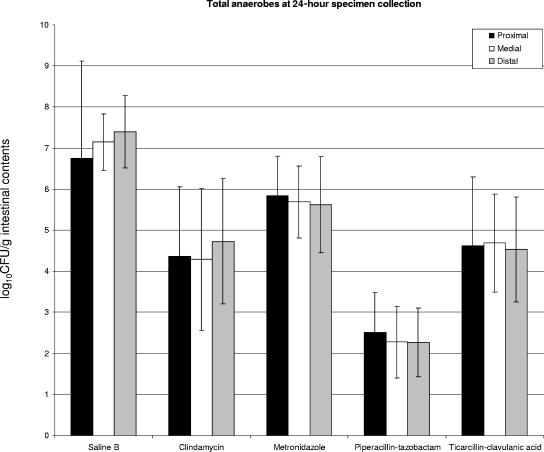
FIG. 5.
Graphic summary of the results from colonization experiments, with separate data for the three portions of the small bowel (proximal, medial, and distal). Columns represent the quantities of total anaerobic bacteria per gram of intestinal contents in the designated segments collected at 24 h. The bars above the columns represent the standard deviations for each set of experiments. All antibiotic groups demonstrated statistically significant reductions compared to the saline control group. Results for piperacillin-tazobactam in comparison to those for clindamycin and metronidazole were also statistically significant.

