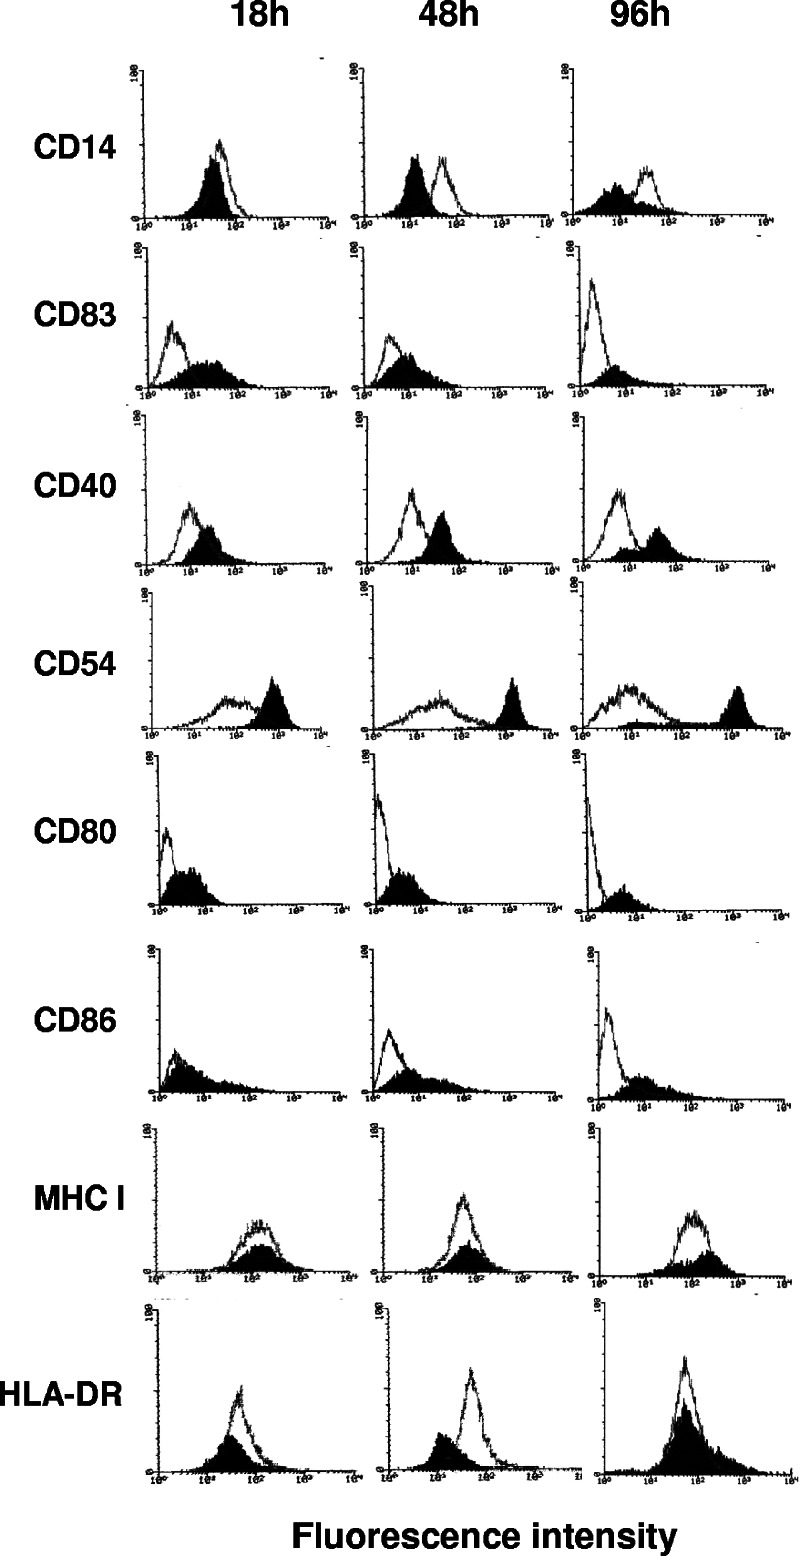
FIG. 3.
Time course analysis of phenotypic modification of THP-1 cells treated with S. gordonii. Flow cytometric analysis of THP-1 cells cultured with S. gordonii at a ratio of 100 bacteria per cell and harvested 18, 48, and 96 h after addition of bacteria. The expression of different surface markers on treated (solid histogram) or untreated (open histogram) cells is reported. In all experiments, the isotype-matched control peak was between a linear value of 0 and 10 on the x axis (data not shown). Data are representative of four independent experiments.

