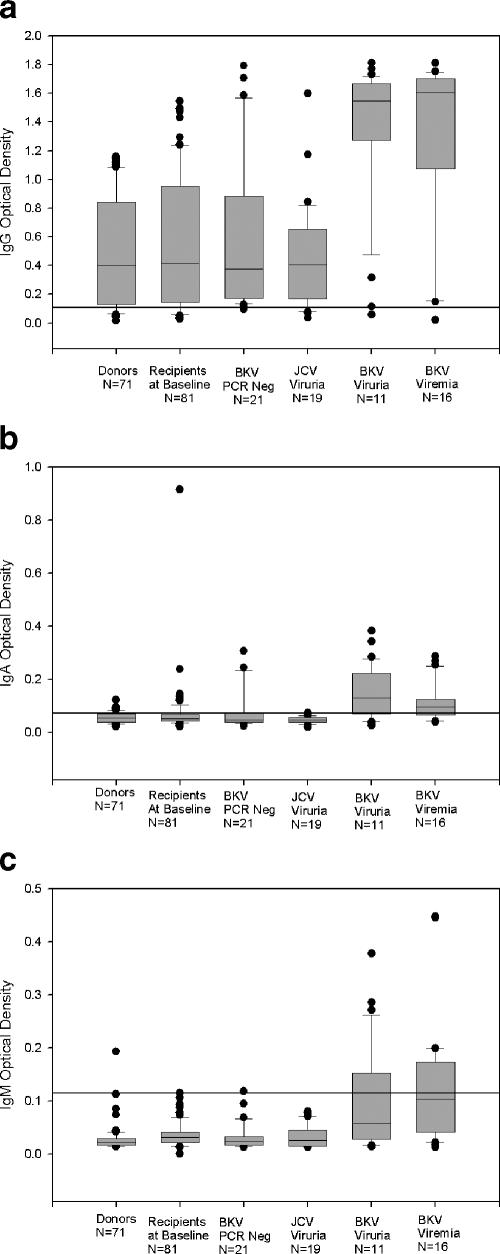
FIG. 1.
Box plots showing optical density readings in the ELISA for IgG (a), IgA (b), or IgM (c) anti-BKV antibodies in different study categories. Each box plot depicts measurements from the 25th to 75th percentile (SigmaPlot 8.0). The error bars correspond to the 10th and 90th percentiles. The horizontal bar in each box represents the median value. Outliers are indicated by the solid circles. The thick horizontal line indicates the optical density cutoff used to define patients as seropositive or seronegative. Subject categories, with the number of subjects in parentheses, are as follows: donors (71), recipient baseline samples (81), posttransplant BKV PCR negative (21), JCV viruria (19), BKV viruria (11), and BKV viremia (16). Optical densities in lanes 5 and 6 are higher than all other categories (P < 0.05).

