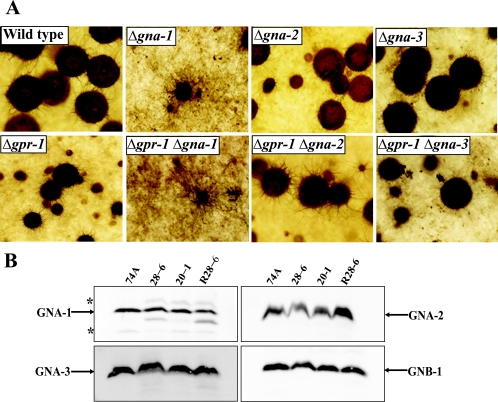
FIG. 4.
Relationship between GPR-1 and G protein subunits. (A) Epistasis analysis between gpr-1 and the three Gα genes. Strains were cultured to produce perithecia as indicated in the legend of Fig. 3A. Wild-type (74A), Δgpr-1 (28-6), Δgna-1 (3B10), Δgna-2 (A33-4), Δgna-3 (31c2), Δgpr-1 Δgna-1 (GP1GN1), Δgpr-1 Δgna-2 (GP1GN2), and Δgpr-1 Δgna-3 (GP1GN3) strains were used for analysis. Photographs were taken at ×25 magnification. (B) Analysis of Gα and Gβ protein levels. The plasma membrane fraction was isolated from SCM plate cultures, and samples containing 25 μg of protein were subjected to Western analysis using specific antisera (see Materials and Methods). Wild-type (74A), Δgpr-1 (28-6 and 20-1), and Δgpr-1 + gpr-1+ (R28-6) strains were used for analysis. The asterisks indicate nonspecific bands.

