
FIG. 4.
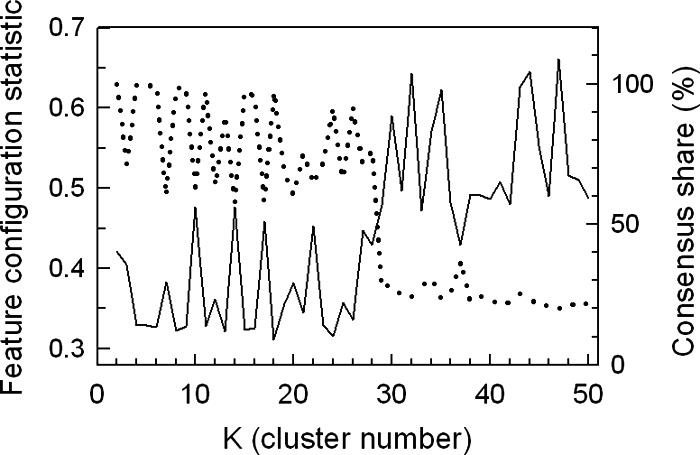
Assessment of clustering quality using the FCS and CS for oxygen-responsive genes identified in galactose medium. The temporal profiles of genes that responded significantly (P < 0.01) to the shifts in oxygen availability in galactose medium (SSG-TEA) were clustered 10 times using an SOM algorithm with 1D ring topology and Pearson correlation as the distance metric. The average FCS P values (solid line, left ordinate) for 2,603 transcription factor consensus binding sequences (TFMs) and CS (dotted line, right ordinate) are plotted as a function of cluster number (K). CS is the percentage of genes that were consistently grouped together over 10 runs of the algorithm. FCS is the probability that the observed configuration of TFMs among gene clusters arose by chance alone from the multinomial distribution dictated by cluster sizes.