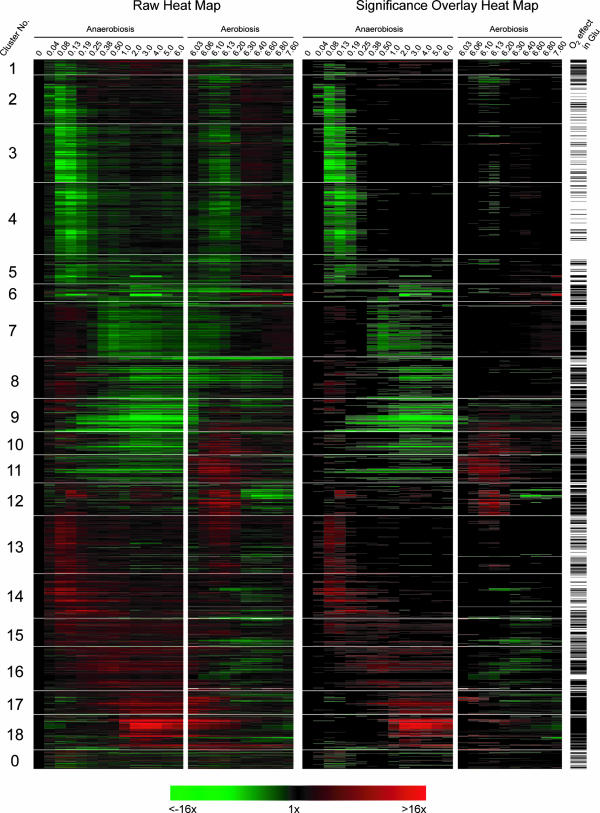
FIG. 5.
Heat maps and statistical comparisons of oxygen-responsive genes identified in galactose medium. The temporal profiles of genes that responded significantly (P < 0.01) to the shift to either anaerobiosis or aerobiosis in SSG-TEA medium were clustered using an SOM algorithm with 1D ring topology (K = 18). The left panel shows the temporal signatures, and the right panel shows the same temporal signatures but with a statistical overlay that masks gene expression changes that were not significantly (P > 0.01) different from the controls (aerobic sample for anaerobiosis and sixth-generation anaerobic sample for aerobiosis). Cluster 0 contains genes that were not consistently placed in the same cluster over 10 replicate runs of the SOM algorithm. Green indicates down-regulated expression, and red indicates up-regulated expression. Bars to the right of the heat map indicate genes that also responded significantly (P < 0.01) to the shift in O2 availability in glucose medium.

