FIG. 4.
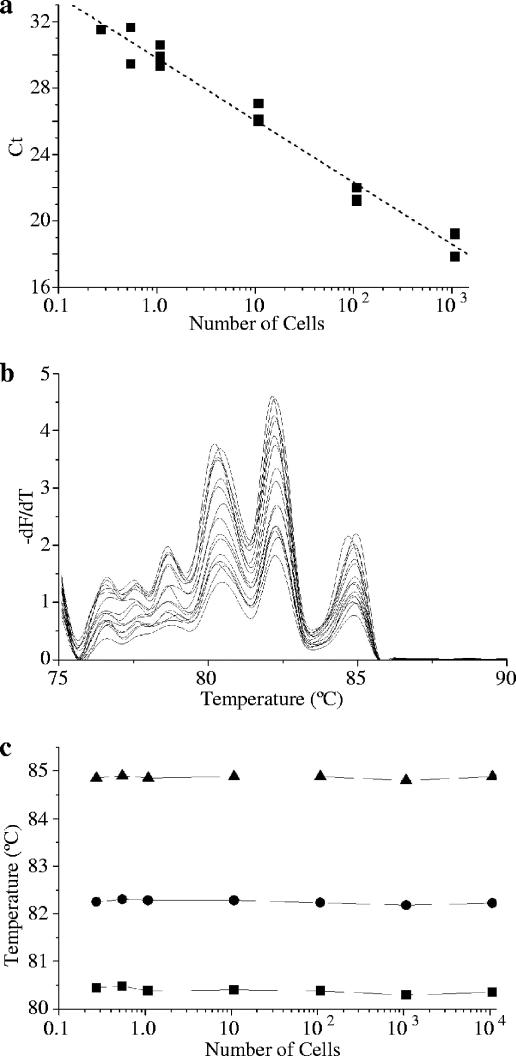
Sensitivity of real-time PCR and integrity of melting curves for N. fowleri NG166. (a) Relationship of CT to DNA concentration, expressed as the log-equivalent number of cells (r = −0.987); (b) melting curves from the corresponding melting analyses; (c) lack of effect of starting template concentration on the position of melting peaks.

