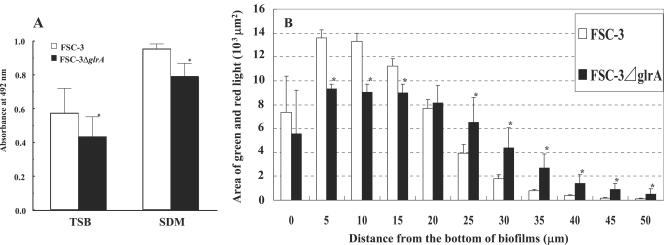
FIG. 7.
Biofilm formation by FSC-3 ΔglrA and FSC-3. (A) Quantification of biofilm after 16 h of culture in TSB and SDM in 96-well microtiter plates. The results are expressed as the means ± standard deviations from three independent assays. (B) Quantification of biofilm after 20 h of culture in TSB using the flow cell system and fluorescence area in xy planes of CLSM images. Each biofilm was scanned at five randomly selected positions. The results are expressed as the means ± standard deviations from three independent assays. Asterisks denote significantly different relative levels of biofilm formation (P < 0.05; versus FSC-3).

