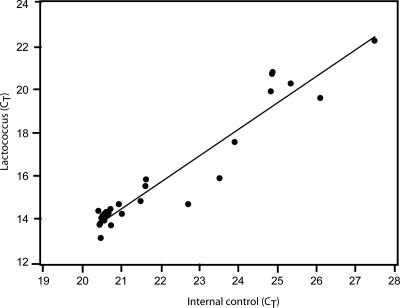
FIG. 2.
Comparison of Lactococcus lactis subsp. lactis INF L2 and internal control DNA after degradation by DNase I. DNA was degraded with DNase I as described in Materials and Methods. A scatter plot and a regression line are shown for the corresponding real-time PCR cycle threshold (CT) values. The squared regression coefficient (R2) for the regression line was 0.92. There was no detectable cross-reactivity between the two primer pairs for the two targets analyzed.

