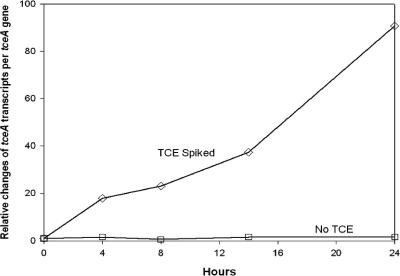
FIG. 1.
tceA gene expression profile of a pure culture of Dehalococcoides ethenogenes 195 in the presence and absence of TCE over 24 h. Measurements of tceA transcripts per tceA gene at each time point are normalized to the value at time zero to obtain the relative changes. Data are calculated from averages of triplicate qPCRs and RT-qPCRs, and error bars are smaller than the box symbol.

