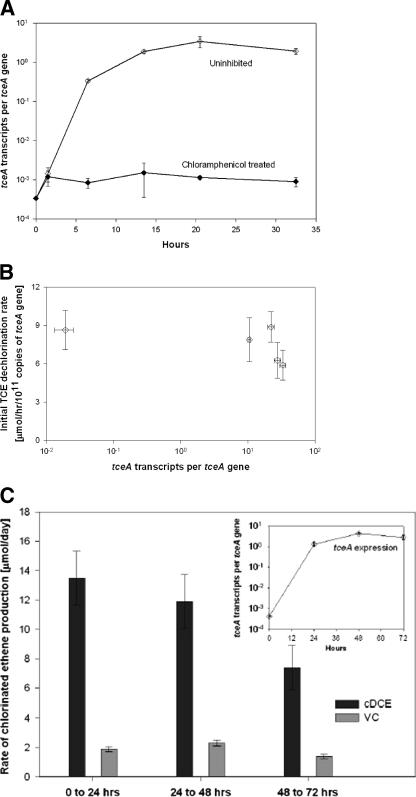
FIG. 4.
(A) tceA gene expression profile with and without the influence of chloramphenicol. (B) Initial dechlorination rate of TCE in the presence of chloramphenicol after the establishment of different transcript levels in five respective cultures. Rate measurements are normalized to the tceA gene copy number. The error bars for the rate measurement represent the 95% confidence interval of the slope of TCE dechlorination over 10 h. (C) Dechlorination activity of the ANAS enrichment culture over three consecutive days as represented by the rate of production of the TCE daughter products cDCE and VC every 24 h. Error bars represent the 95% confidence interval. The inset graph shows tceA gene expression during the 3 days of active dechlorination.

