
FIG. 2.
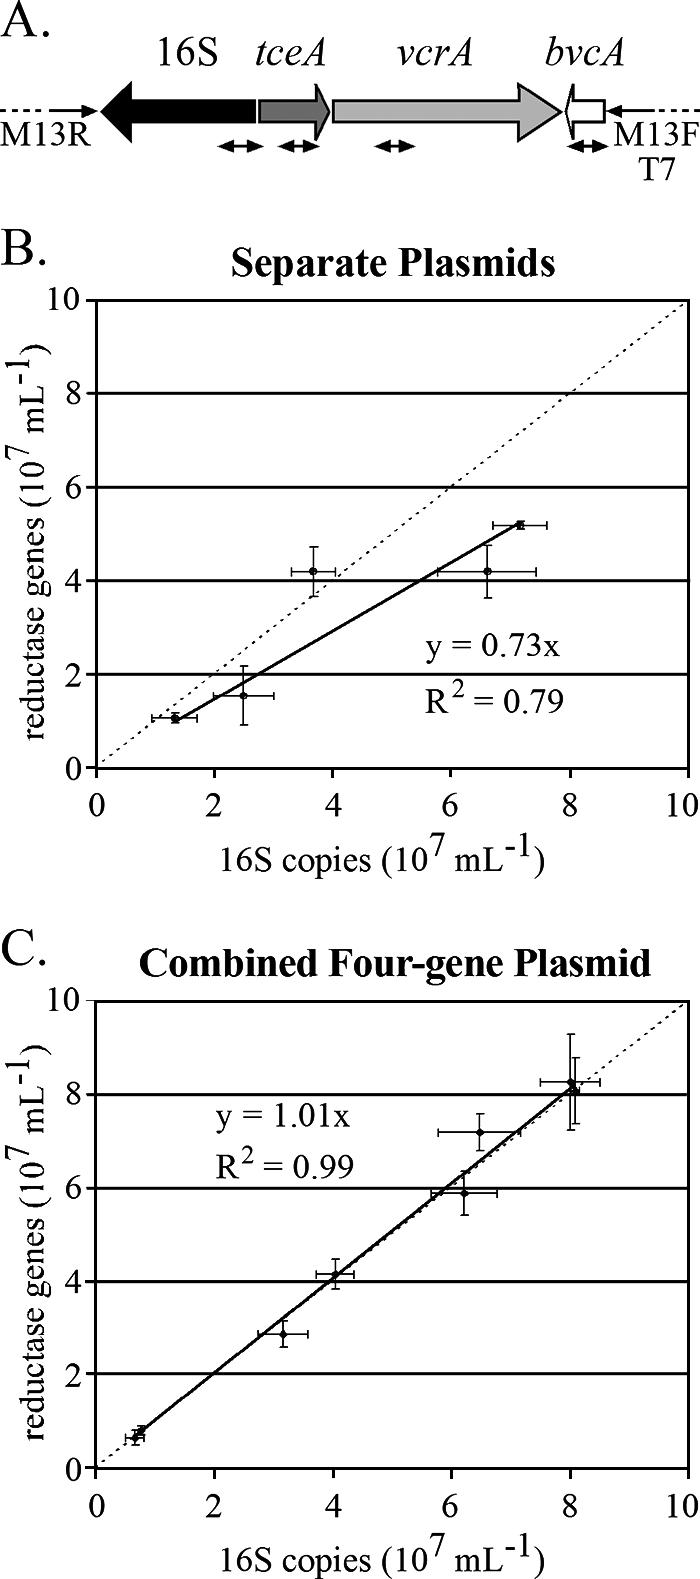
(A) Map of the four-gene qPCR plasmid standard generated in the present study. The small double-headed arrows indicate the qPCR amplicons. (B) Dehalococcoides 16S rRNA copy number versus reductive dehalogenase copy number in qPCR experiments using DNA from the ANAS culture and D. ethenogenes 195 and separate plasmid standards for 16S, tceA, and vcrA, and bvcA. (C) Same as in panel B, but using the four-gene Dehalococcoides plasmid standard. The dashed lines in panels B and C show a 1:1 ratio for reductive dehalogenase and 16S rRNA genes; the solid lines indicate a best fit to the data.