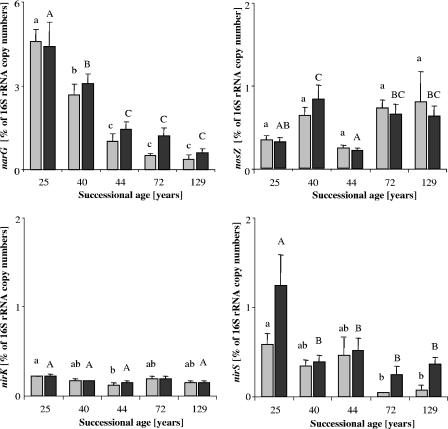
FIG. 2.
Relative densities of narG, nirK, nirS, and nosZ gene fragments in soils across a receding glacier foreland. Gray bars, August 2004; black bars, September 2004. Data of sampling sites not sharing a common capital letter are statistically different for September (P < 0.05); data of sampling sites not sharing a common lowercase letter are statistically different for August (n = 5; results are means and standard errors).

