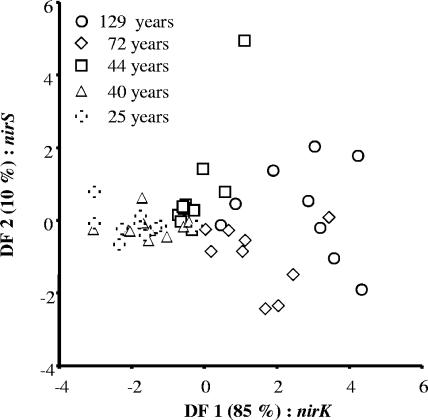
FIG. 3.
Discriminant analysis of quantitative PCR data of gene copy numbers for 16S rRNA and denitrification genes (narG, nirK, nirS, and nosZ) from selected sites within the glacier foreland differing in successional age. The labels of the two axes give the percentage of explained variance as well as the most important factor responsible for the separation of the data along the corresponding axis.

