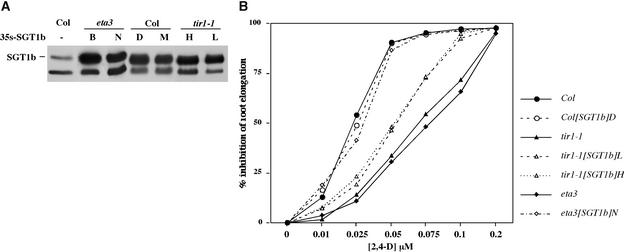
Figure 6.
Analysis of ETA3/SGT1b Overexpression.
(A) Protein gel blot analysis with anti-SGT1b antiserum of crude extracts prepared from single rosette leaves of control and 35S-SGT1b T1 plants. Letters above the lanes indicate specific transgenic lines. Col, Columbia.
(B) Dose–response assay of auxin response in control and homozygous 35S-SGT1b lines. All data points are averages of 12 seedlings, and all standard deviations are ≤10% of the mean.

