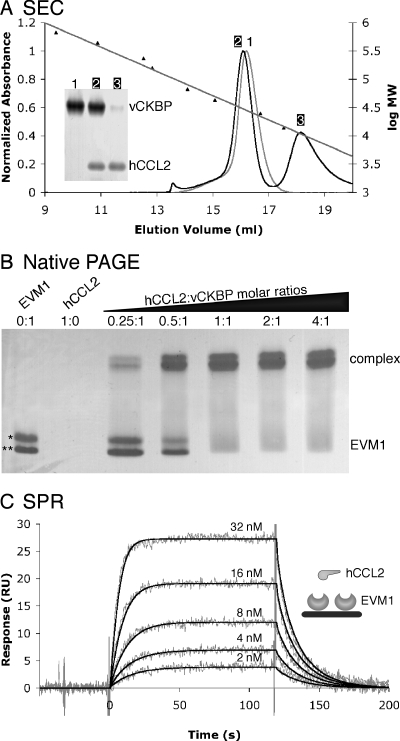
FIG. 1.
EVM1 binds CC chemokines with 1:1 stoichiometry and high affinity. (A) SEC indicates that EVM1 is a monomer in solution that is able to bind a single chemokine. Elution profiles are shown for EVM1 alone (gray curve) and EVM1 mixed with a twofold molar excess of hCCL2 (black curve). The mean elution volumes for standard proteins used to calibrate the Superdex 200 10/300 GL column are shown with their linear fit versus log molecular weight (log MW). The inset gel shows that peak 1 contains EVM1 alone, peak 2 contains both EVM1 and hCCL2, and peak 3 contains excess hCCL2. (B) Native PAGE provides further evidence for the 1:1 stoichiometry. EVM1 runs as two bands due to multiple signal peptide cleavage sites (*, EVM1 amino acids 1 to 235; **, EVM1 amino acids 7 to 235), and hCCL2 does not enter the gel due to its high pI (∼9). A shift occurs when EVM1 binds to chemokine, and this shift is complete at a 1:1 molar ratio. (C) SPR analysis of hCCL2 binding to EVM1 immobilized on a CM5 chip. Shown are response curves for a typical chemokine titration experiment. The experimental curves (gray lines) were globally fit using a 1:1 mass transport model (black lines) to determine the kinetics parameters presented in Table 1. The inset shows a schematic representation of the experimental setup.

