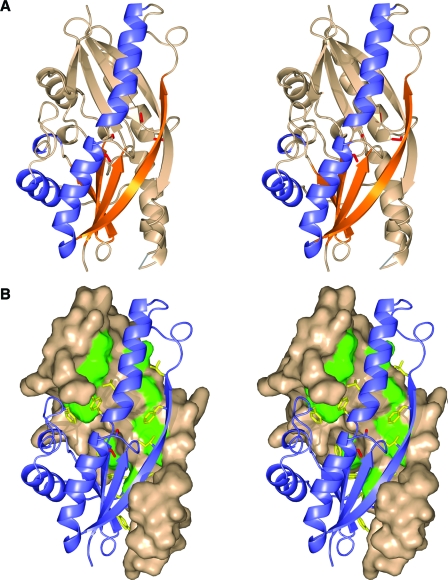
FIG. 2.
G4 dimers. (A) Stereo view of the G4 dimer as a ribbon diagram. One monomer is colored by secondary structure as in Fig. 1, and the other is colored beige. The long β-strands that form due to the dimerization are shown. A gray line represents a loop between strand β2b and helix α2 that was not built into the model due to disorder in the crystal. The cysteines are colored red. (B) Stereo view of the interface of the dimer as a solvent-accessible surface representation of one molecule and a ribbon representation of the second molecule. The hydrophobic residues of the dimer are colored green in the surface representation and depicted as yellow sticks in the ribbon representation.

