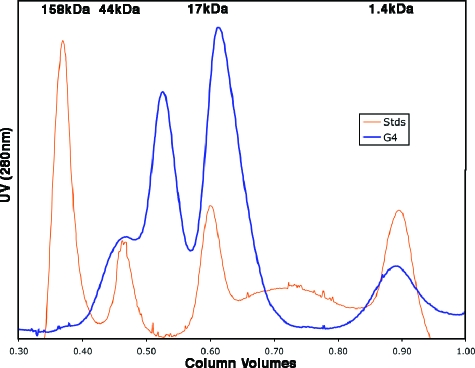
FIG. 3.
Size exclusion chromatogram of G4. This representative 280-nm absorption profile of G4 (molecular mass of 14.0 kDa), shown in blue, indicates two major populations of G4, consistent with a monomer-dimer equilibrium. The protein was run in phosphate-buffered saline buffer with the addition of 5 mM dithiothreitol. Immediately prior to the G4 run, molecular size standards (Stds) were run under the same conditions (orange peaks) with their molecular masses given at the top of the chromatogram.

