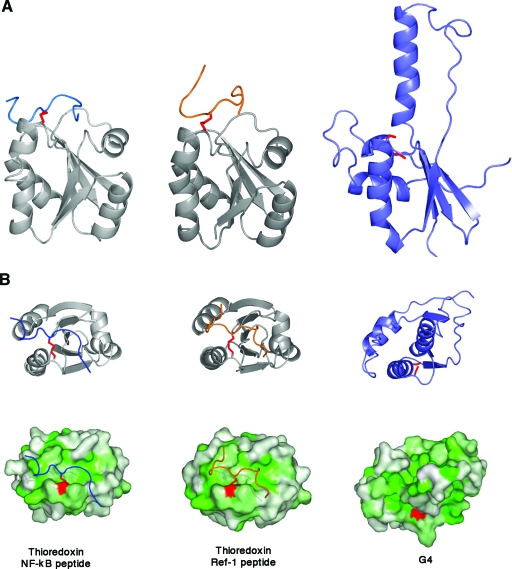
FIG. 5.
Comparison of substrate binding sites of thioredoxin-like proteins. (A) Ribbon diagrams of thioredoxin bound to a peptide from NF-κB (left) (PDB code 1MDI) and Ref-1 (center) (PDB code 1CQG). A similarly oriented G4 is shown (right), illustrating the extended “finger” region protruding through the peptide binding surface found in thioredoxin. (B) Ribbon diagrams of thioredoxin bound to a peptide from NF-κB (left) or Ref-1 (center) and a similarly oriented G4 (right). Surface representations are shown below each ribbon diagram in panel B, illustrating the hydrophobic cleft of the binding site on thioredoxin. The view of G4 shows the occlusion of the binding site due to the extended “fingers” region. The surfaces are colored from white to green representing increasing hydrophobicity.

