
FIG. 2.
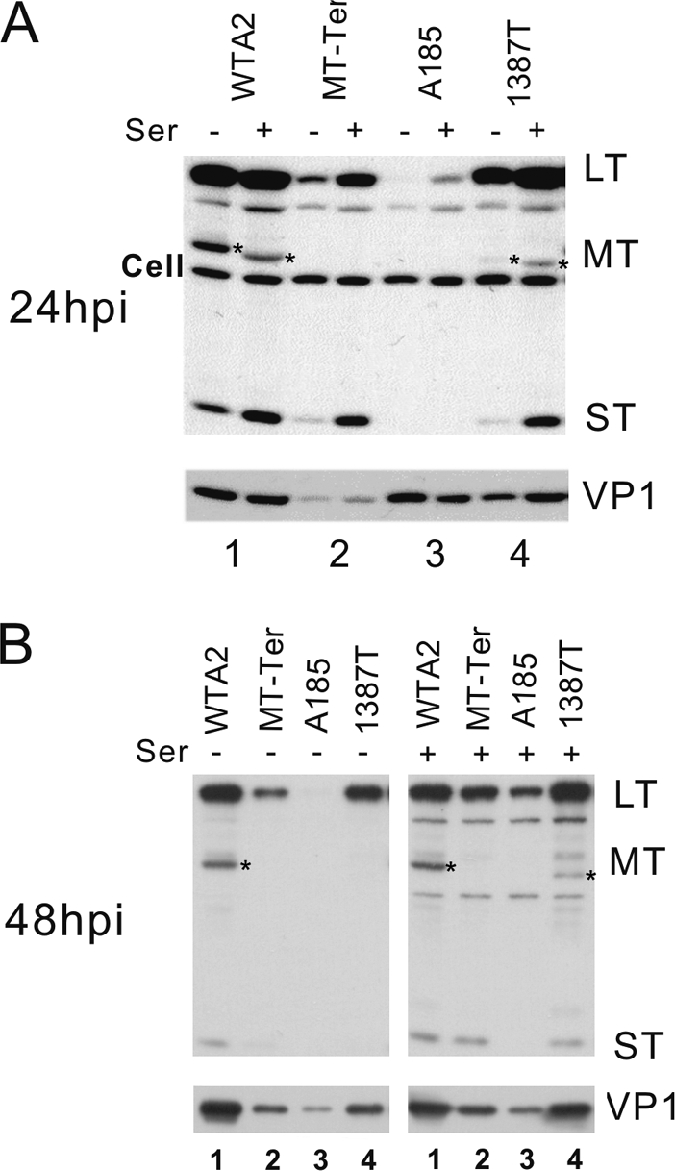
Gene expression patterns of viral strains with MT null and/or ST null mutations. NIH 3T3 cells were infected with equal doses of the wild type and mutants as indicated above the lanes. Doses of input virus genomes were verified by Southern blotting analysis (see Fig. 7, below). Infection and Western blotting conditions are described in Materials and Methods. Infected cells were cultivated in medium containing 0.5% (−ser) or 10% serum (+ser). Protein samples were collected at 24 hpi (A) or 48 hpi (B). The exposure of the blot with the 48-hpi samples was shorter than that for the 24-hpi blot. The positions of LT, MT(*), and ST are indicated on the right. Note the overlap in migration of the MT-Ter and ST proteins and the smaller size of 1387T MT. The antibody used cross-reacts with some cell proteins (Cell bands). The intensity of these cellular bands serves as a loading control. The lighter exposure at 48 hpi failed to reveal the cellular band. The membranes were stripped and reprobed with an antibody for the late capsid protein (VP1). Different arrangements of the samples were chosen to display the 24- and 48-hpi samples. (A) Alternating the results for samples with and without serum highlights the effect of serum factors on viral gene expression. (B) The display of all samples under the same serum treatment condition highlights strain-specific differences in viral gene expression.