
FIG. 7.
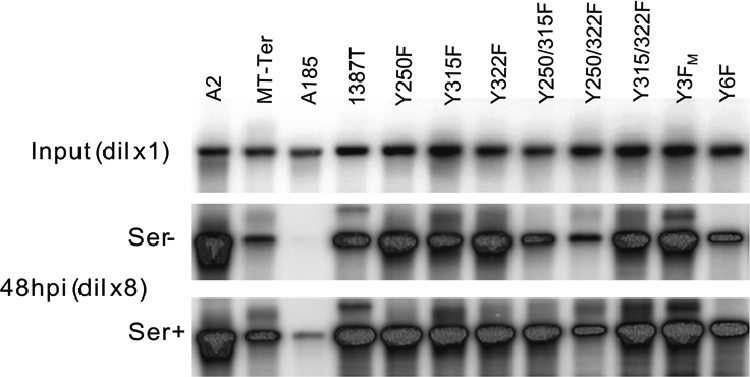
Genome amplification patterns of mutant viruses. NIH 3T3 cells were infected under the conditions described in the legend to Fig. 4. Input samples were harvested at 4 hpi, and experimental time points were simultaneous to times for protein samples shown in Fig. 4, namely, at 24 (data not shown) and 48 hpi. DNA extraction (total DNA) and Southern blot analysis are described in Materials and Methods. Visualization of ethidium bromide-stained total DNA was provided a control for equal loading. All blots were hybridized with the same probe. The quantitation of these blots is given in Table 2.