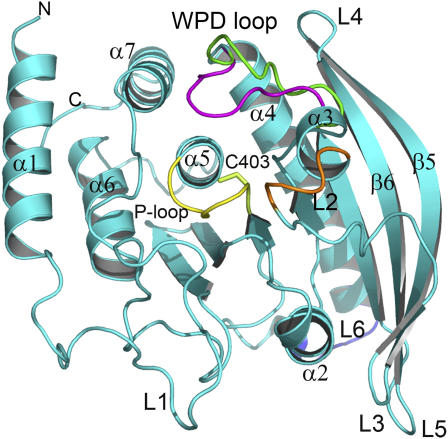
FIGURE 1.
Schematics of the YopH structure. The WPD loop is shown in the open (green) and closed (magenta) conformation. The P-loop is colored in yellow. Other loops are named according to the observation with increased fluctuations in molecular dynamics simulations (see Fig. 2 B). The figure was prepared using the PyMol software.

