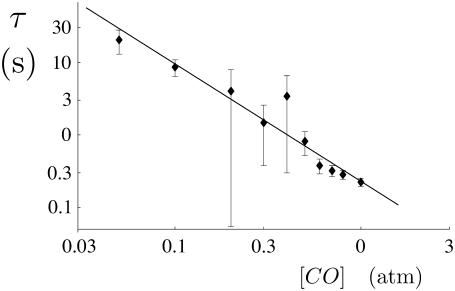
FIGURE 5.
The variation of the lifetime of the fiber τ with the concentration of CO, as estimated from DIC video microscopy. The best-fit line has the slope α = −1.62, characterizing the power law τ ∼ [CO]α. The error bars show the variation of our measurements about the mean (1 SD) over a total of 86 measurements taken over nine different CO concentrations. Aside from the large intrinsic stochastic variations, which the error bars mostly reflect, our assessment of the underlying experimental errors is that they are mainly associated with the imprecision in measuring the depolymerization times by subjective inspection of the video and might typically be 10–20%, i.e., rather small compared to the stochastic variation.

