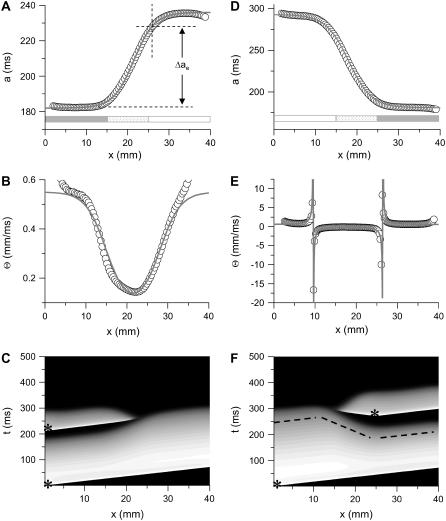
FIGURE 2.
APD distribution in space and waveback velocity from a heterogeneous 1D cable of the LR1 model (symbols in each panel) under the baseline (S1) stimulation. (A) APD distribution for an ascending gradient in space (symbols), which was fit by  (line). The shaded bar marks the region with high
  , open bar for low
  , and
, and  changes linearly as in Eq. 2 in the patterned bar region. The dashed lines illustrate the calculation of Δae, the effective refractory barrier used for Eqs. 9 and 10. The intersection of the vertical dashed line and the top one is the point with the critical APD gradient for conduction block. (B) Waveback velocity measured from the cable for the APD heterogeneity in A (○) and calculated using Eq. 5 with the fitting function in A (line). (C) Time-space plot showing conduction block of S2 beat in the cable with ascending APD gradient as in A. Voltage changes from −85 mV to 20 mV as color changes from black to white. The stars mark the time and location at which S1 and S2 were given. (D) APD distribution for a descending gradient fitted by
  .
.  mS/cm2 was used in Eq. 2. (E) Waveback velocity for the heterogeneity in D. The line was calculated using Eq. 5 with the fitting function in D. (F) Time-space plot showing conduction block of S2 beat in the cable with descending APD gradient as in D. Voltage changes from −85 mV to 20 mV as color changes from black to white. The stars mark the time and location at which S1 and S2 were given. The negative slope portion of the dashed line marks the retracting waveback or the negative waveback velocity portion.

