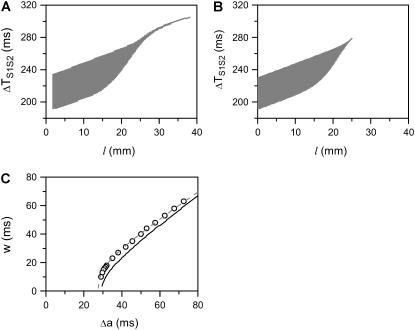
FIGURE 4.
Effects of APD gradient on conduction block when APD gradient is ascending. (A) Vulnerable window w (shaded, the range of the S1S2 coupling interval  that conduction block occurs) versus the location l of the S2 extrasystole obtained from the ionic model (Eq. 1). The APD distribution is the same as in Fig. 2 A. (B) Same as A but obtained from the kinematic simulation (Eq. 8). (C) Vulnerable window w versus the APD difference Δa from the ionic model (symbol), the kinematic simulation (solid line), and Eq. 9 (dashed line) for S2 applied at l = 0. In simulation of the ionic model, Δa was generated by varying
  in Eq. 2. In the kinematic simulation,
  ,
,  , and dc=10 ms (at which θc = 0.22 mm/ms) were used. For Eq. 9, θ0 = 0.55 mm/ms, θc = 0.22 mm/ms, τ = 10, h = 10 mm, and an effective APD difference Δae = 0.9Δa was used. Δae was the effective APD barrier as illustrated in Fig. 2 A.

