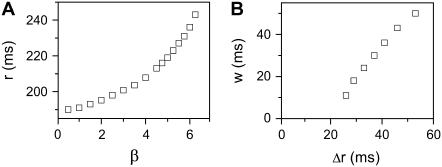
FIGURE 6.
Effects of ERP heterogeneity on vulnerability. (A) ERP versus β. β is a parameter that measures the change in Na+ conductance and recovery, which is defined as in B. (B) w versus the ERP difference Δr for S2 applied at l = 0. The ERP gradient was generated by linearly changing  to
to  mS/cm2, and
  to
to  in a region h = 10 mm, in the same manner as Eq. 2. Uniform
  mS/cm2 was used. Since Na+ kinetics has a small effect on APD but a big effect on ERP (as shown in A), the APD distribution in the cable is almost uniform but large ERP gradient occurs.

