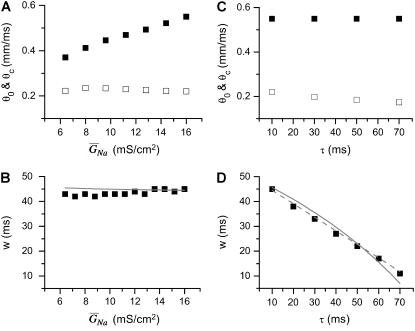
FIGURE 7.
Effects of Na+ channel conductance and recovery on vulnerability to conduction block in heterogeneous cable with the heterogeneity as in Fig. 2 A. (A) θ0 and θc versus  . (B) Vulnerable window w versus
  . (C) θ0 and θc versus τ. (D) Vulnerable window w versus τ. In D, the dashed line was obtained from Eq. 9 by using σ = Δa/h = 5 ms, θ0 = 0.55 mm/ms, and θc = 0.2 mm/ms. The solid line was obtained by accounting the correction of θc shown in (C). S2 was applied at l = 0.

