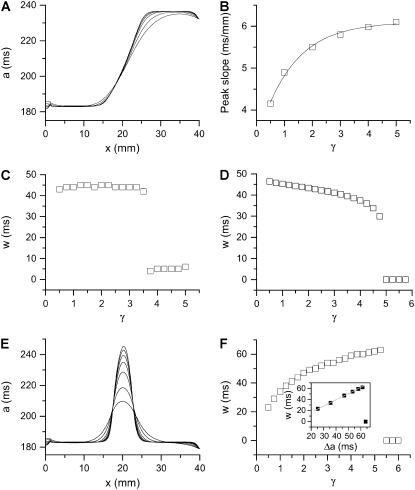
FIGURE 8.
Effects of gap junctional conductance on vulnerability to conduction block. (A) APD distribution in space for the different diffusion constants ( cm2/ms in Eq. 1, from lowest curve to top: γ = 0.5, 1, 2, 3, 4, and 5) under baseline (S1) stimulation. (B) Maximum gradient versus γ for the APD distribution in A. (C) w versus γ from the 1D cable of the LR1 model (Eq. 1). (D) w versus γ from Eq. 9 in which Δa = 50 ms,
  , τ = 10 ms,
  mm/ms, and
  mm/ms were used. (E) APD distribution in space for different diffusion constants (from lowest curve to top: γ = 0.5, 1, 2, 3, 4, 5, and 6). APD heterogeneity was generated by setting
  mS/cm2 except in a 5 mm segment in the middle of the cable, in which
  mS/cm2. (F) w versus γ from the 1D cable of the LR1 model with the heterogeneity in E. The inset shows w versus Δa. S2 was applied at l = 0.

