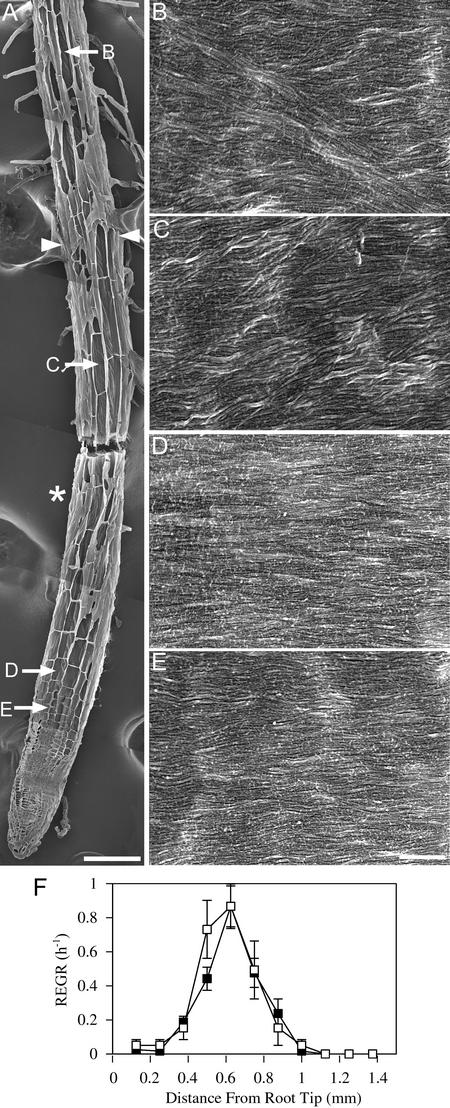
Figure 3.
Growth Patterns and Cellulose Microfibril Orientations in mor1-1 Roots Grown at 21°C Are Indistinguishable from Those of the Wild Type.
(A) Field emission scanning electron micrograph of a 5-day-old mor1-1 root tip grown at 21°C. The root tip was cryo-planed to expose the inner tangential and radial walls of many epidermal cells. The asterisk marks the approximate point where the maximum relative elemental growth rate was measured in equivalent roots. Arrowheads show the limits of the elongation zone. The locations of the higher magnification micrographs shown in (B) to (E) are indicated. Bar = 100 μm.
(B) to (E) Higher magnification micrographs showing detailed cellulose microfibril texture from cells in the postelongation zone (B), the late elongation zone (C), the early elongation zone (D), and the cell division zone (E). Bar = 300 nm.
(F) Relative elemental growth rates (REGR) measured over a 1-h period for 5-day-old mor1-1 (closed squares) and wild-type (open squares) root tips show that mor1-1 and the wild type have very similar growth profiles at 21°C.

