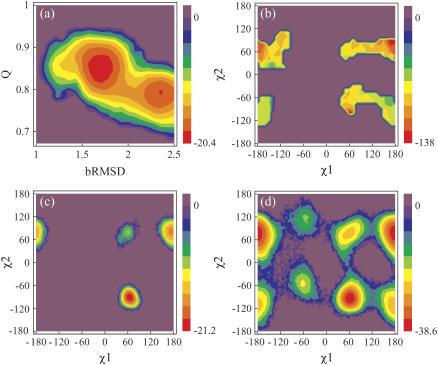
FIGURE 1.
Energy contour maps in units of kJ mol−1. (a) Free energy as a function of Q and bRMSD, from PT. The highest bRMSD well corresponds with a loss of the 310-helix structure. (b) Potential energy in function of Trp8 χ1 and χ2, from DEE. The energies are calculated as the total nonbonded energies Etotnb for all structures with a negative Etotnb. Free energy in function of Trp8 χ1 and χ2 from (c) PT and (d) 500 K MD. The relative free energy ΔG between two states i and j with relative populations Pi and Pj is calculated as  , where R denotes the universal gas constant.

