Figure 6.
Seed and Endosperm Development in Intraspecific and Interspecific Crosses between A. thaliana and SAS.
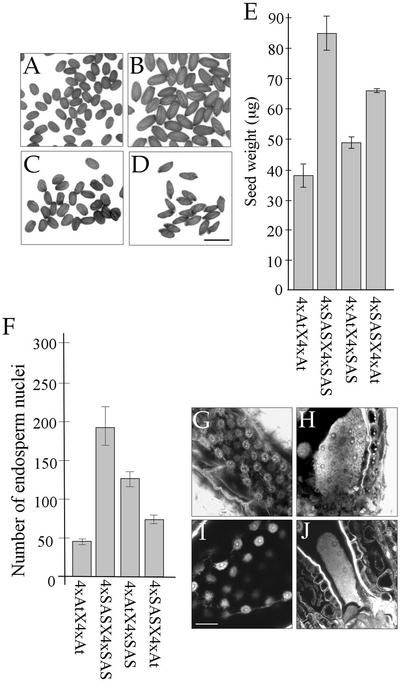
(A) to (D) Mature seeds: [4xAt × 4xAt] (A), [4xSAS × 4xSAS] (B), [4xAt × 4xSAS] (C), and [4xSAS × 4xAt] (D). Bar = 1 mm.
(E) Mean weight of desiccated mature seeds from (A) to (D), calculated as for Figure 1F. From left to right: 38.3 ± 4.4 μg (n = 4), 84.2 ± 6.4 μg (n = 5), 49.0 ± 1.8 μg (n = 6), and 65.9 ± 0.2 μg (n = 3).
(F) Central PE nuclei, counted as for Figure 3B. Each bar represents the mean number of endosperm nuclei in seeds at the mid-globular stage of embryogenesis (n = 3). From left to right: 46 ± 4.9, 191 ± 28, 126 ± 9.3, and 71 ± 3.5.
(G) to (J) Confocal micrographs of Feulgen-stained seeds at 6 DAP showing the proliferation of PE ([G] and [I]) and ChE ([H] and [J]). Bar = 50 μm.
(G) and (H) [4xAt × 4xSAS].
(I) and (J) [4xSAS × 4xAt].

