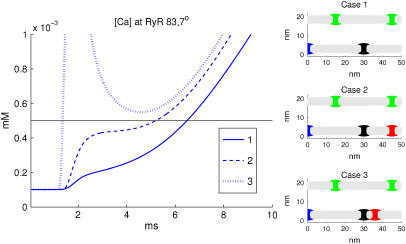
FIGURE 7.
Calcium concentration at the RyR site closest to the LTCC using kc = 50nm2/ms The right-hand panel shows the channel placement for the three different cases. The blue channel at the y axis represents the LTCC, the black channel at 30 nm is the NCX, and the red channel represents the Na+ channel. The two green channels above represent RyR sites.

