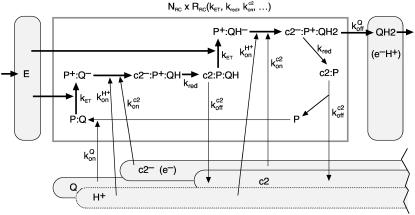
FIGURE 3.
Detailed view of the processes that take place inside the reaction center. This network of reactions belongs in the boxed area of the overview figure (Fig. 2). All these individual reactions with their individual rates k together determine the overall conversion rate RRC of a single RC. As in Fig. 2, the thick arrows denote the flow of the energy from the excitons through the cyclic charge-state changes of the special pair Bchl (P) of the RC. Again, as in Fig. 2, the rounded rectangles denote the reservoirs, which are here labeled with the respective transporter molecule. The abbreviations are the same as used throughout the text and in Fig. 2.

