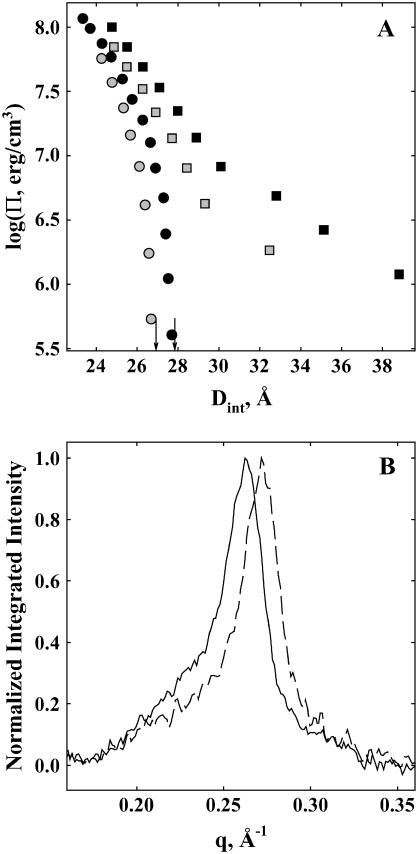
FIGURE 1.
Effect of MPD on DNA force curves. (A) The spacing between DNA helices, Dint, measured by x-ray scattering is shown as a function of the osmotic pressure of PEG, ΠPEG, acting on the condensed DNA array. The salt concentration was 1.2 M NaBr for shaded squares and solid squares and 2 mM Co(NH3)6Cl3 for shaded circles and solid circles, both with 10 mM TrisCl, pH 7.5, at 20°C. The MPD concentration was 0 in solid squares and solid circles and 1 molal in shaded squares and shaded circles. The arrows indicate the equilibrium interhelical spacing in the absence of PEG for Co3+-DNA with and without added MPD. Changes in the number of water molecules in the DNA phase that exclude MPD can be determined from the change in interhelical spacing as the MPD concentration is varied at constant ΠPEG. An excess MPD osmotic pressure can be calculated from the difference in PEG osmotic pressures with and without added MPD at a constant spacing. (B) The x-ray scattering profiles of DNA condensed with 2 mM Co(NH3)6Cl3 in the absence of PEG and with an MPD concentration of 0 (solid line) and 1 molal (dashed line), both with 10 mM TrisCl, pH 7.5, at 20°C. MPD exclusion creates an osmotic pressure on the Co3+-DNA array that results in a 0.9 Å decrease in Dint, as observed by the shift in the Bragg scattering peak maximum to higher scattering vector, q.

