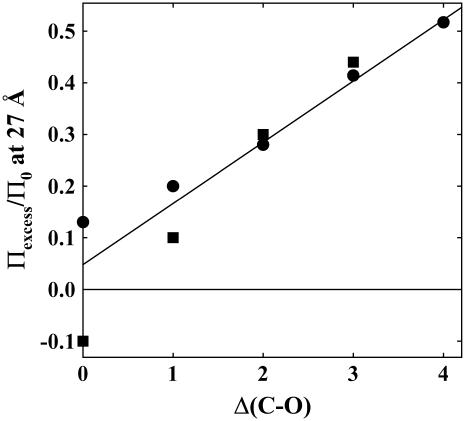
FIGURE 5.
Exclusion of alcohols scales with the number of alkyl carbons in excess of hydroxyl groups, Δ(C-O). Values of Πexcess/Π0 at 27 Å versus Δ(C-O) are shown for two cases: circles, the data for all 12 nonpolar alcohols shown in Fig. 3 are averaged, methanol is the only representative for Δ(C-O) = 0; squares, only alcohols with four carbons are included, 1- 2-, and t-butanol, 1,4- and 2,3-butanediol, 1,2,4-butanetriol, and threitol. The data for Δ(C-O) = 2 − 4 varies approximately linearly, suggesting that exclusion amplitudes can be calculated by simply summing over the constituent chemical groups. The diverging behavior at Δ(C-O) = 0 and 1 reflects the attractive interactions of alcohols with multiple hydroxyl groups with Spd3+-DNA.

