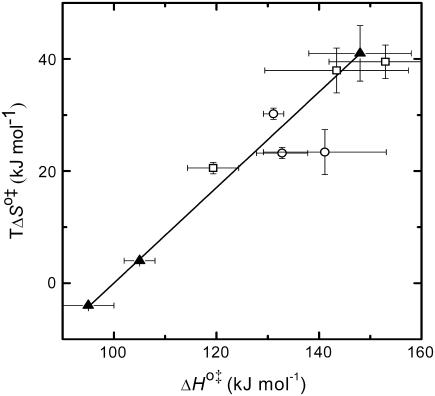
FIGURE 5.
Representation of the enthalpic component versus the Gibbs' free energy of the activation state in the translocation of NBD-DMPE (□), translocation of NBD-LysoMPE (○), and permeability of dithionite (▴) in the lipid bilayers tested (data from Tables 2 and 3). The error bars are the standard deviations. The best fit of a straight line for the data on the permeability of dithionite is also shown.

