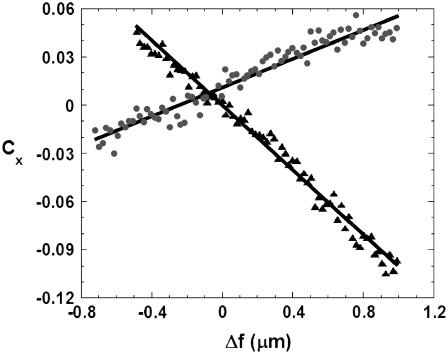
FIGURE 4.
Contrast inversion curve as a function of Δf for the central (▴) and right lateral (•) peaks of a Gaussian ruffle. Using Eqs. 7a and 7b to fit these data, we obtained h0Δn = (0.0161 ± 0.0002) μm for the central peak and h0 = (0.31 ± 0.02) μm, Δn = (0.051 ± 0.005) for the right lateral peak. Since both curves belong to the same structure, we can use the value of h0 obtained from the fit on the lateral peak to obtain Δn = (0.052 ± 0.005) for the central peak. For this ruffle, w = 0.4 μm. The distance between the central and the lateral peaks was 0.7 μm.

