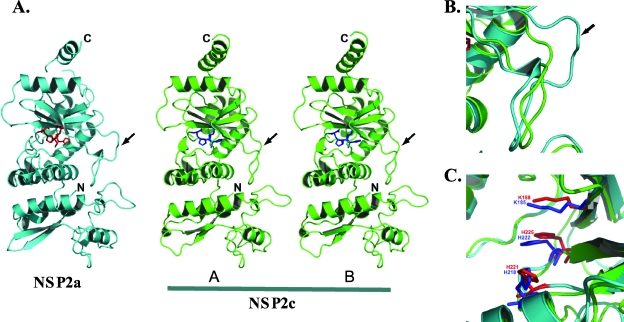
FIG. 2.
Comparison of the monomeric subunits of NSP2a and NSP2c. (A) Ribbon diagram of NSP2a (cyan) and the two molecules (A and B) in the crystallographic asymmetric unit of NSP2c (green). The locations of the N and C termini are denoted. The catalytic residues of NSP2a (His 225, His 221, and Lys 188) are shown in red, and those of NSP2c (His 222, His 218, and Lys 185) are shown in blue. The loop (residues 170 to 185) is shown by an arrow. (B) A close-up view of the superposition of the loop regions showing noticeable differences between NSP2a and NSP2c structures. In both panels B and C, the same color scheme as in panel A is used. (C) A close-up view of the superposition of catalytic residues in NSP2a and NSP2c structures.

