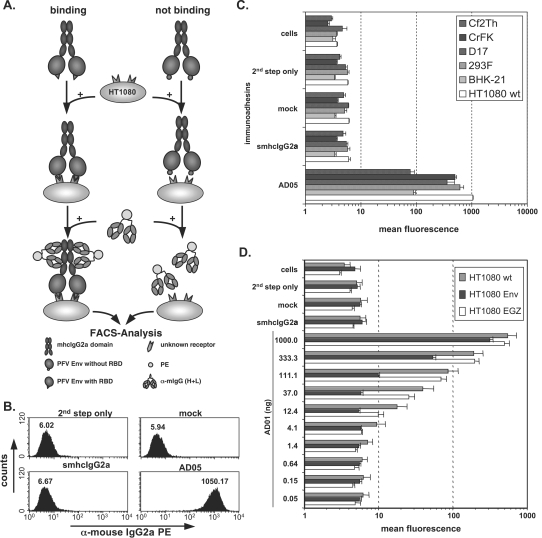
FIG. 1.
Cell binding assay. (A) Schematic outline of the cell-based, flow cytometric immunoadhesin binding assay. (B) Representative examples of FACS histogram profiles from HT1080 cells incubated with different controls or the AD05 immunoadhesin supernatant. Staining was done in a volume of 830 μl using 50 ng immunoadhesin. (C) Graphic representation of the mean fluorescence and standard deviation (n = 3) of different target cell lines, as indicated, stained with the AD05 immunoadhesin or the corresponding control stains. (D) Mean fluorescence values and the corresponding standard deviations (n = 3) for serial dilutions of the AD01 immunoadhesin or different controls on HT1080 cells stably expressing wild-type PFV Env and EGZ (HT1080 Env) or expressing only EGZ (HT1080 EGZ) or of unmodified cells (HT1080 wt). For the smhcIgG2a control, 1,000 ng recombinant protein was used. Staining of all samples was done in a total volume of 1,270 μl. Abbreviations: cells, unstained cells; 2nd step only, incubation with FACS buffer and 2nd step reagent only; mock, supernatant from 293T cells transfected with the empty pczCFG5IEGZ retroviral vector; smhcIgG2a, supernatant from 293T cells transfected with psmhcIgG2a secreting only the IgG2a domains; PE, phycoerythrin; α, anti.

