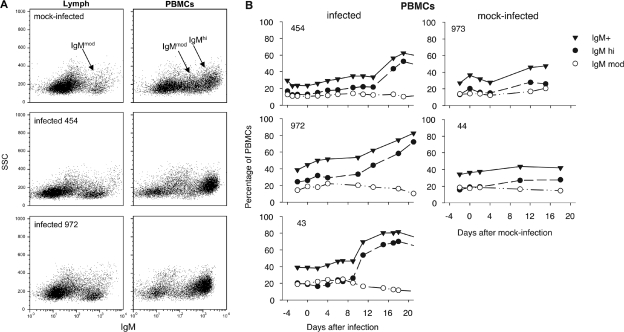
FIG. 7.
Accumulation of cells with high levels of surface IgM in blood, but not lymph, of BLV-infected animals. (A) Dot plots of surface-stained, live-gated lymph cells (left) and PBMCs (right) are displayed as side scatter (SSC) versus intensity of IgM staining. IgM+ cell populations from cannulated sheep 973 are from day 15 after mock infection; cells from infected sheep 454 (day 19) and 972 (day 18) are from the days of peak incidence of infectious centers. (B) Percentages of IgM+, IgMhi, and IgMmod cells among live-gated PBMCs from BLV-infected and mock-infected sheep were obtained using FloJo software from additional gates drawn around the populations shown in panel A and are plotted as a function of time after injection of allogeneic cells.

