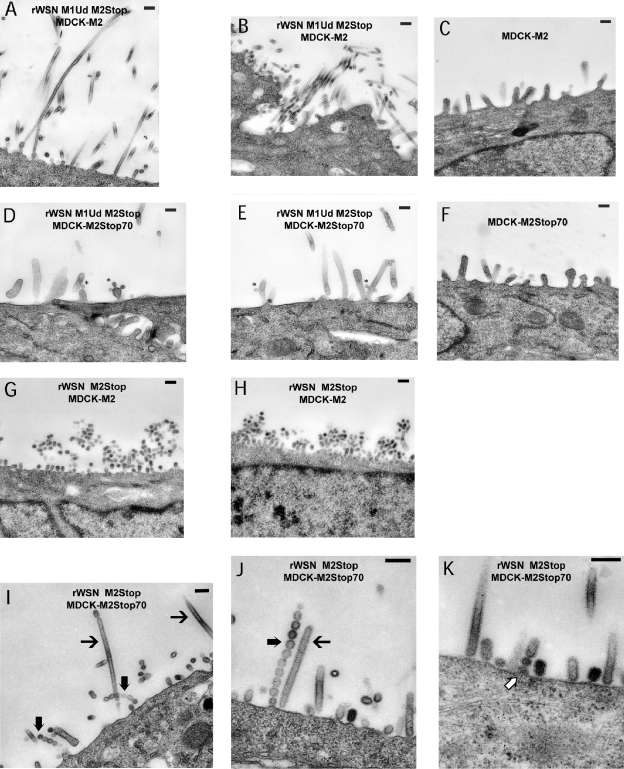
FIG. 4.
Thin-section transmission electron microscopy images of budding influenza particles. MDCK-M2 (A, B, C, G, and H) and MDCK-M2Stop70 (D, E, F, I, J, and K) cells were infected at an MOI of 5.0 with rWSN M2Stop or rWSN M1Ud M2Stop. The cells were infected for 12 h and then processed and imaged by TEM. MDCK-M2 cells were infected with rWSN M1Ud M2Stop (A and B) or rWSN M2Stop (G and H). MDCK-M2Stop70 cells were infected with rWSN M1Ud M2Stop (D and E) or rWSN M2Stop (I to K). →, elongated filamentous particles; ➞, linear spherical particles; ⇒, budding linear spherical particles; *, budding particles. Bars, 200 nm. (C and F) Mock-infected cells. The text in the figures indicates the virus (top line) and cell line (bottom line) used in that panel. Two panels for each condition are shown to demonstrate infected cells from independent experiments and multiple fields.

