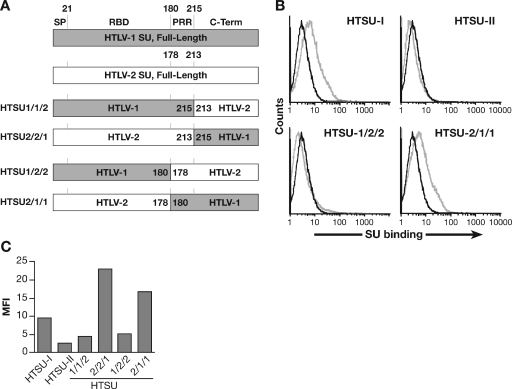
FIG. 5.
Differences in HTLV-1 and HTLV-2 binding to CD4+ T cells map to the C-terminal region of SU. (A) Schematic drawing of the SU coding regions of the vectors encoding parental and recombinant soluble HTLV SU. (B) CD4+ T cells, from adult peripheral blood, were activated for 3 days by PHA and IL-2. The binding of 100 ng of HTSU-IgG, HTSUII-IgG, HTSU1/2/2-IgG, HTSU2/1/1-IgG, and the control SUA was determined by flow cytometry. Black line, SUA-IgG; gray line, soluble HTLV SU. The mean fluorescence intensity values were as follows: for HTSU-IgG, 4.6; HTSUII-IgG, 0.5; HTSU1/2/2-IgG, 0.7; HTSU2/1/1-IgG, 3.6. (C) CD4+ T cells isolated from adult peripheral blood were activated with PHA and IL-2. The binding of 200 ng of HTSU-IgG, HTSUII-IgG, HTSU1/2/2-IgG, HTSU2/1/1-IgG, HTSU1/1/2-IgG, HTSU2/2/1-IgG, and the control SUA was determined by flow cytometry.

