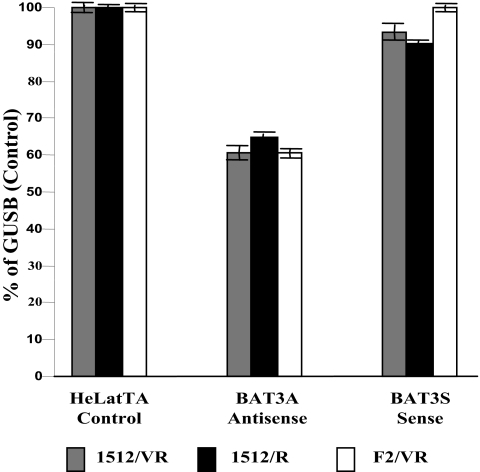
FIG. 6.
Expression of BAT3 transcripts as measured by reverse transcription-PCR in HeLatTA, BAT3 antisense, and BAT3 sense cells. Three sets of primers derived from different exons were used to quantify BAT3 mRNA. The oligonucleotide sequence for each primer is shown in Materials and Methods. The y axis represents the percentage of expression relative to the GUS β-glucuronidase positive control.

