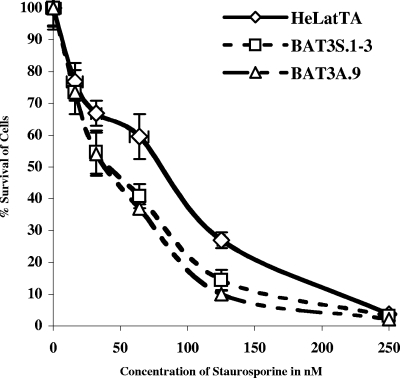
FIG. 7.
Viability of BAT3 EST-expressing cell lines in the presence of staurosporine. Approximately 104 cells were grown for 24 h in each 96-well dish in different concentrations of staurosporine. The cells were then assayed for viability by the MTT method. Each point is the mean of three measurements, and the mean of the standard deviation for each point is shown as a bar in the figure. Three independent experiments were performed for this assay. The x axis shows the concentration of staurosporine used in the assay, and the y axis shows the percentage of cells that survived compared to cells without staurosporine treatment.

