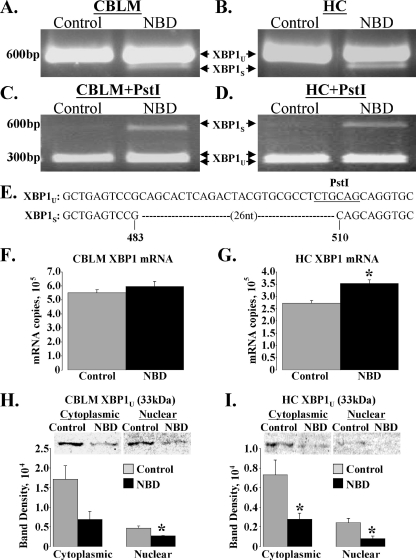
FIG. 4.
XBP1 mRNA is selectively spliced in NBD rats. RNA extracted from CBLM and HC of PND28 control (n = 5) and NBD (n = 7) rats was analyzed by RT-PCR using primers that amplify both unspliced XBP1 (XBP1U) and spliced (XBP1S) XBP1. (A and B) Representative gel images of XBP1 RT-PCR. Note detection of XBP1U in control rats and both XBP1U and XBP1S in NBD rat CBLM (A) or HC (B). (C and D) PstI digestion of XBP1 RT-PCR products. Note PstI-insensitive XBP1S band in NBD but not control rat CBLM (C) and HC (D). (E) Sequencing of XBP1U and XBP1S from CBLM and HC confirms excision of the 26-nucleotide intron from XBP1S in NBD rats. (F and G) SYBR Green real-time PCR analysis of total XBP1 mRNA in CBLM and HC of control (n = 5) and NBD (n = 7) rats. Note that XBP1 mRNA expression levels are unchanged in NBD CBLM (F) but are significantly increased in NBD HC (G: 1.3-fold increase in NBD; ANOVA, P = 0.005). (H and I) Western blot analysis of XBP1U (33 kDa) protein levels in CBLM and HC cytoplasmic and nuclear extracts from control (n = 4) and NBD (n = 4) rats. Representative blots are shown. (H) Relative band densities for CBLM extracts revealed a trend toward decreased XBP1U protein in cytoplasmic extracts (2.49-fold decrease in NBD; ANOVA, P = 0.065) and a significant decrease in nuclear extracts (1.72-fold decrease in NBD; ANOVA, P = 0.017) from NBD rats compared to controls. (I) Relative band density for HC extracts revealed significant decreases in XBP1U protein in both cytoplasmic (2.63-fold decrease in NBD; ANOVA, P = 0.033) and nuclear (3.02-fold decrease in NBD; ANOVA, P = 0.018) extracts from NBD rats compared to results for controls. Asterisks indicate P values of <0.05.

