FIG. 6.
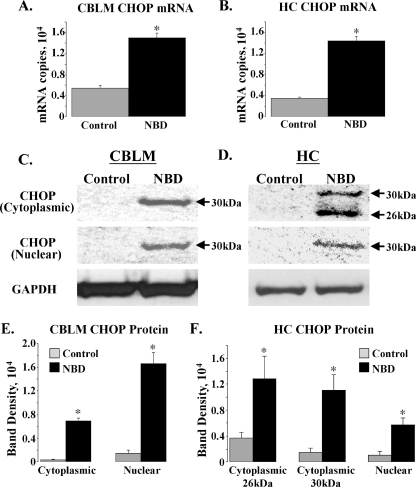
Increased CHOP mRNA and protein in NBD rats. (A and B) Real-time PCR analysis of CHOP mRNA in CBLM (A) and HC (B) of PND28 control (n = 5) or NBD (n = 7) rats. CHOP mRNA was significantly increased for NBD rats relative to results for control CBLM (A: 2.77-fold increase in NBD; ANOVA, P < 0.0001) or HC (B: 4.14-fold increase in NBD; ANOVA, P < 0.0001). (C and D) Representative Western immunoblots for CHOP protein in cytoplasmic (top panel) or nuclear (middle panel) extracts from control or NBD rat CBLM (C) or HC (D). Corresponding cytoplasmic immunoblot signals for GAPDH are shown (bottom panel). (E and F) Determination of CHOP protein band density in cytoplasmic and nuclear extracts from control (n = 4) or NBD (n = 4) rat CBLM (E) or HC (F). CBLM CHOP protein levels were significantly increased in both cytoplasmic (E: 21.4-fold increase in NBD; ANOVA, P < 0.0001) and nuclear (E: 11.34-fold increase in NBD; ANOVA, P = 0.0003) extracts from NBD rats, relative to results for controls. HC CHOP protein levels were significantly increased in both cytoplasmic (F: 26-kDa band, 3.48-fold increase in NBD; ANOVA, P = 0.043; and 30-kDa band, 7.49-fold increase in NBD; ANOVA, P = 0.009) and nuclear (F: 5.47-fold increase in NBD; ANOVA, P = 0.02) extracts from NBD rats, relative to controls. Asterisks indicate P values of <0.05.

