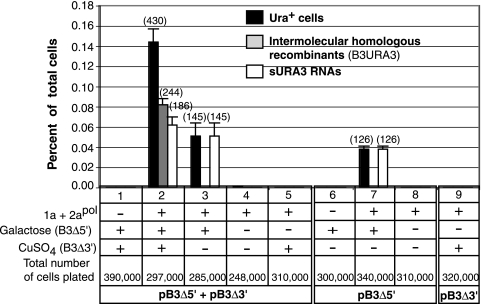
FIG. 3.
Frequency of Ura+ cells, RNA recombination, and formation of sURA3 RNAs. The presence (+) or absence (−) of BMV replication proteins 1a and 2apol and plasmids encoding parental RNAs is indicated. The histogram shows the averages and standard errors corresponding to results from three independent repetitions of the experiment. The number of relevant events found is indicated in parentheses. The corresponding number of cells plated is indicated. Black bars represent the percentage of cells that acquired the Ura+ phenotype and harbored either an intermolecular B3URA3 RNA recombinant (gray bar) or an sURA3 RNA (white bars).

